USER SATISFACTION SURVEY OPTIMIZATION
Role
User experience design, User interface design
Tool
MasterGO
Client
Meituan
Duration
2 weeks
Background
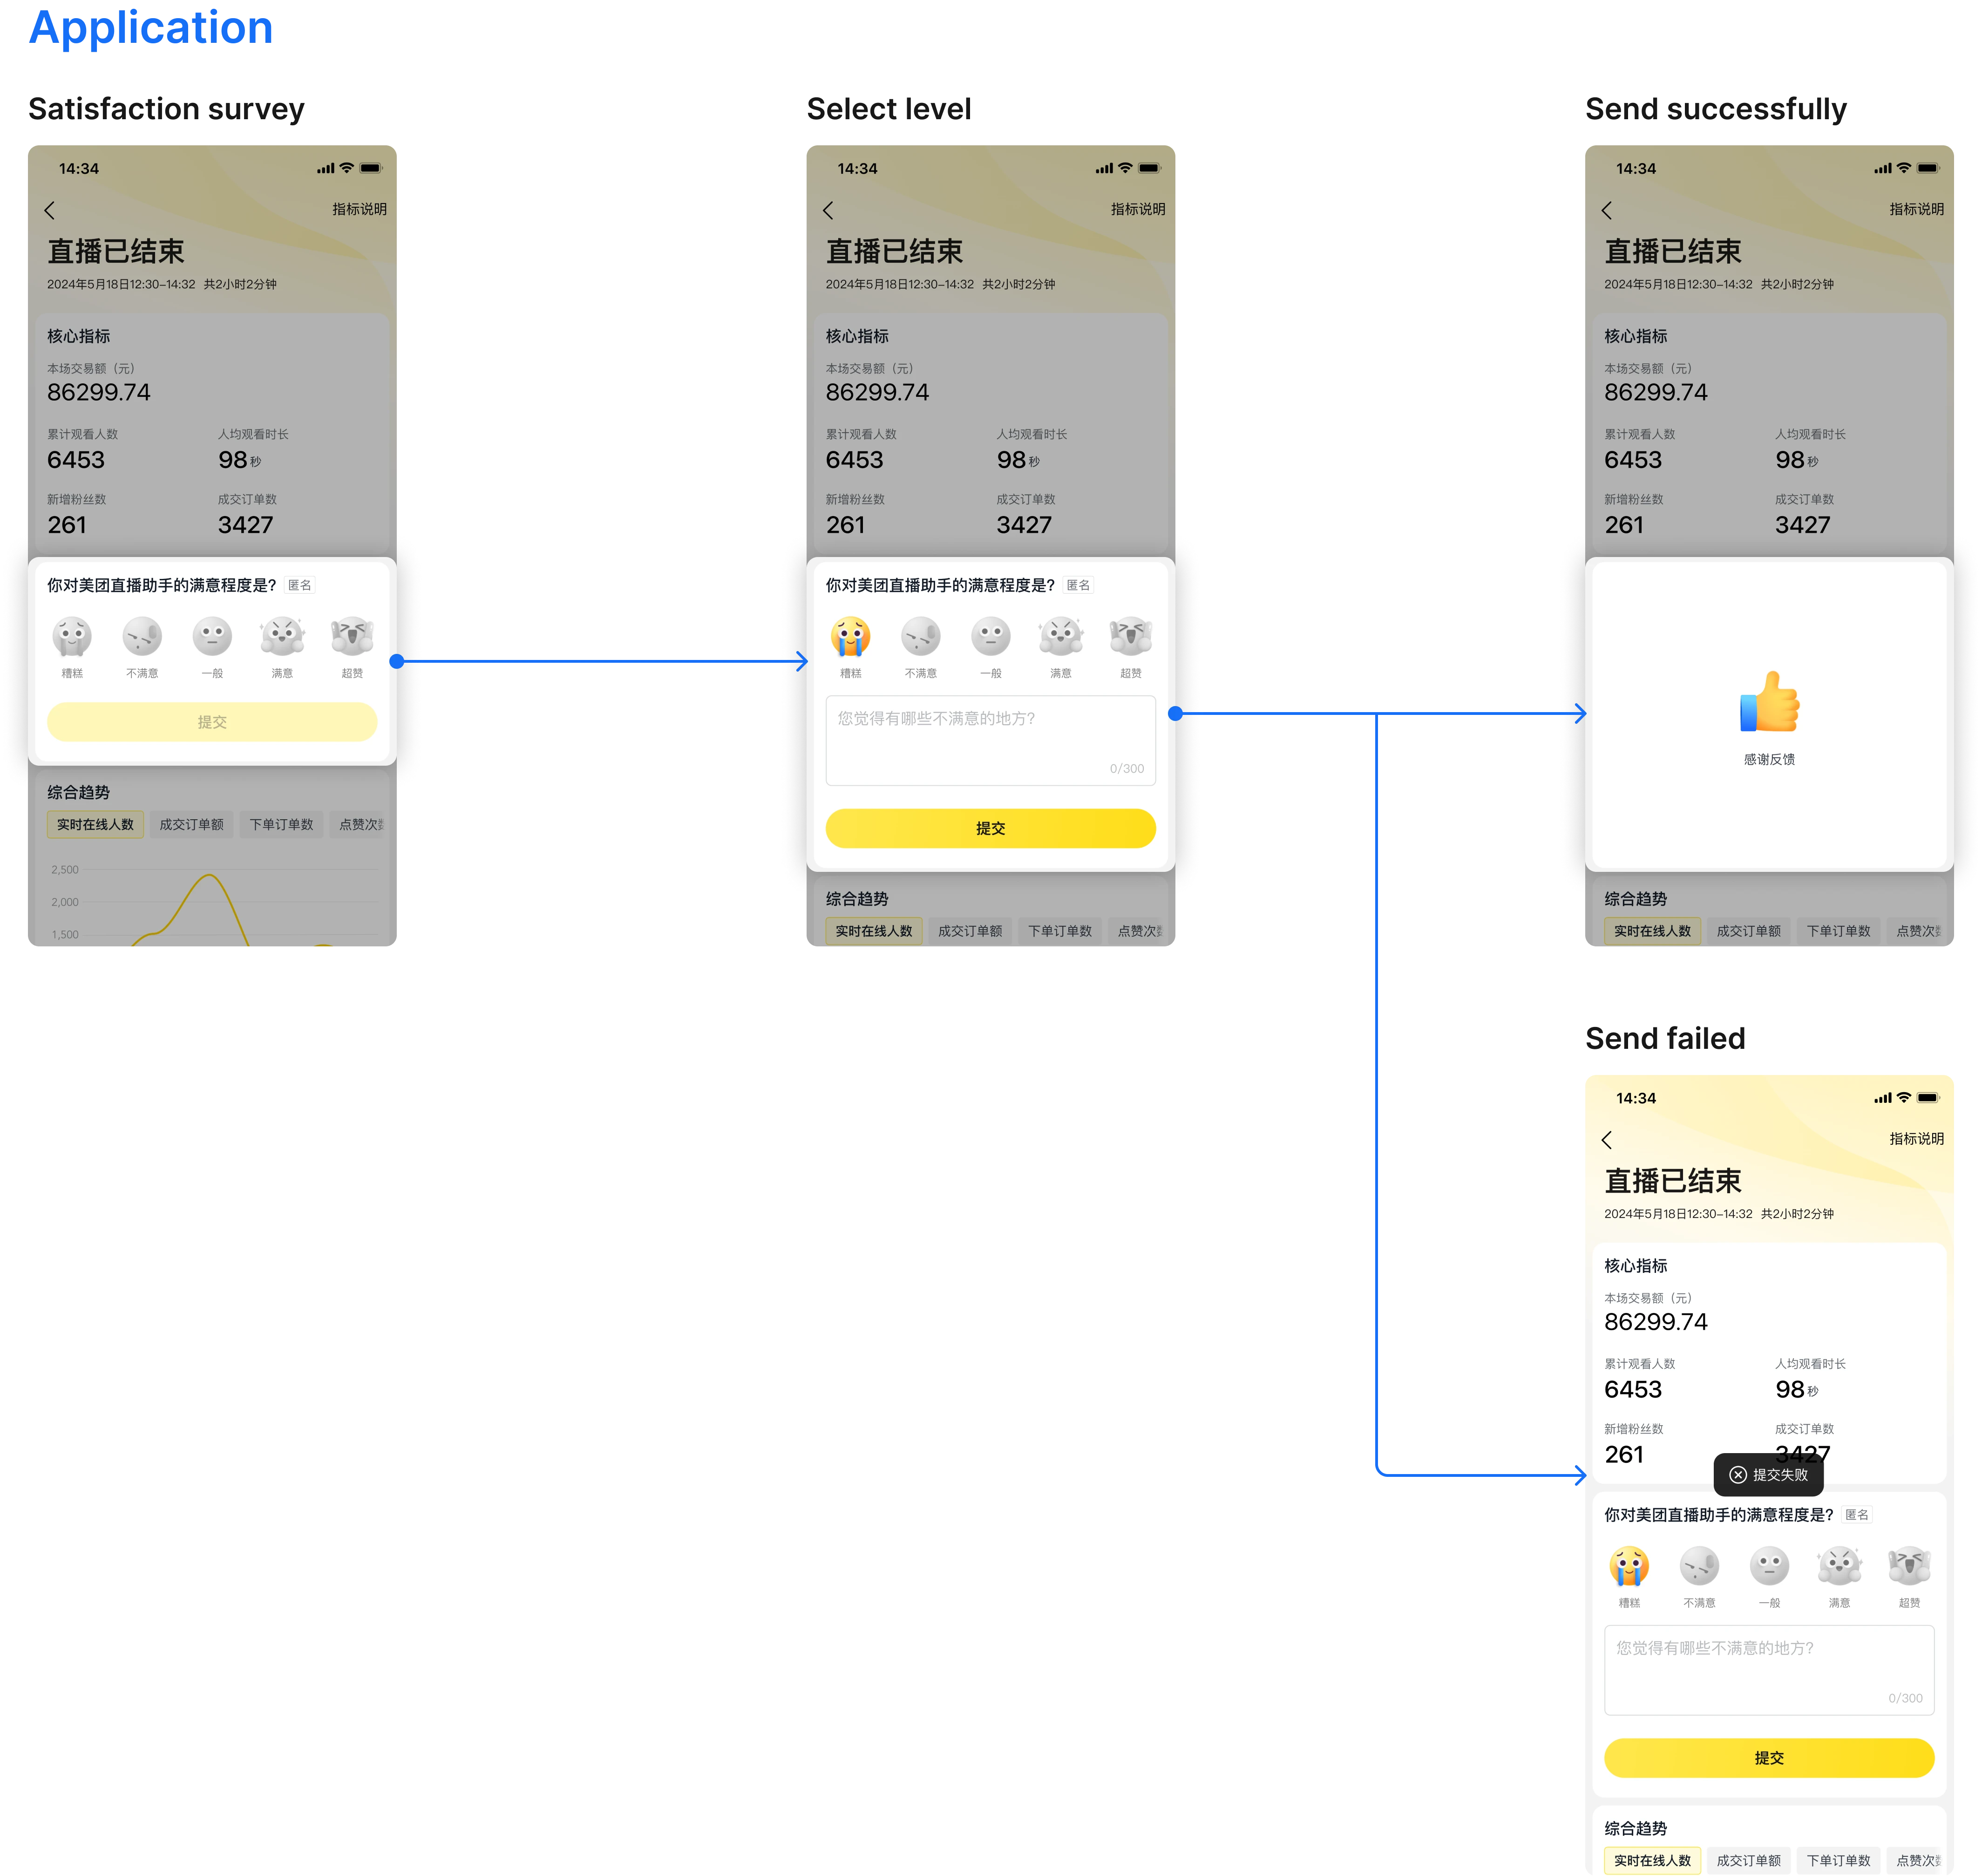
Meituan frequently conducts user satisfaction surveys, which previously popped up when users opened the Meituan Livestream Assistant. Data showed that 11% of respondents had never used the livestream function yet still completed the surveys. These respondents tended to give higher ratings, slightly inflating the overall satisfaction score and reducing the validity of the results. To improve data accuracy, I adjusted the timing of the survey, making it appear in the pop-up window at the end of the livestream. So, only users who have used the livestream function provide feedback.

User Satisfaction Evaluation Index
There are three major evaluation indexes for user experience: Customer Effort Score (CES), Customer Satisfaction (CSAT), and Net Promoter Score (NPS).
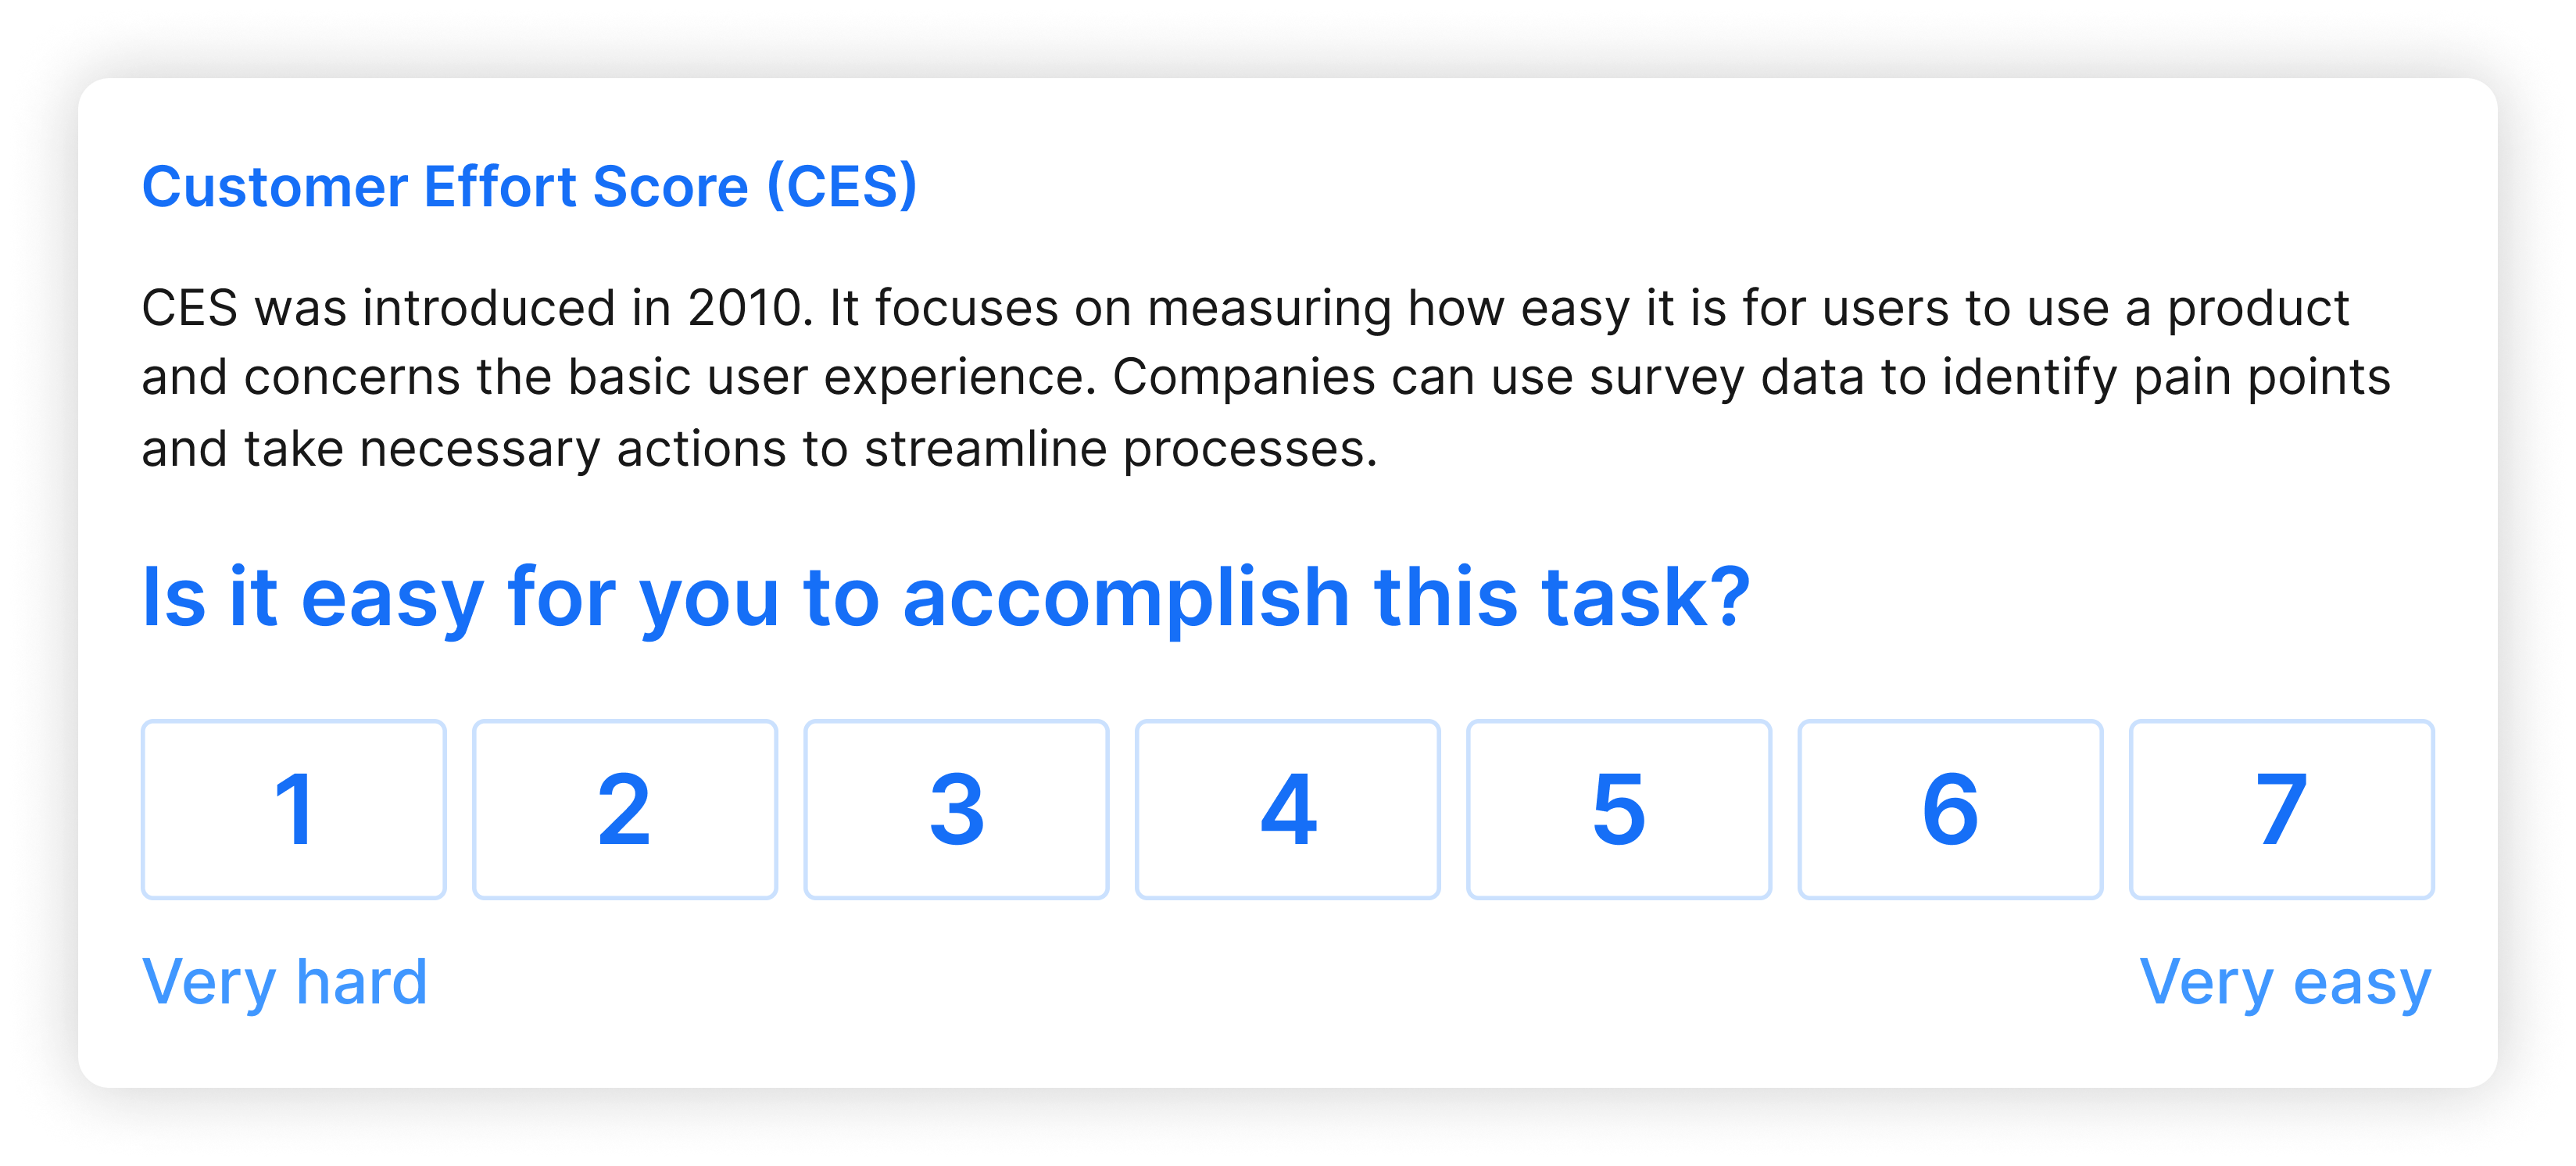


Meituan Livestream Assistant is primarily designed to support streamers in their livestream activities. Given this specific use case, streamers are unlikely to recommend it to others, making NPS less reliable for evaluation. Additionally, CES is too basic to capture the overall satisfaction level of users. Therefore, I decided to use CSAT.
Customer Satisfaction (CSAT)
The CSAT survey uses attitudinal scales, where participants indicate to what extent they agree with given statements. The scale typically consists of 5 response levels, though variations exist with 4, 6, 7, or 9 levels. However, odd-numbered scales are recommended, as even-numbered scales eliminate the neutral option, forcing users to take a stance. If a user's true preference is neutral, this forced choice can introduce bias into the data.

Additionally, some surveys use 11 response levels to improve data accuracy by providing more granularity. However, a 2008 experiment by Dawes found no significant differences in the main data characteristics across scales with varying response levels. Moreover, increasing the number of response levels prolongs response time and contributes to user fatigue, potentially lowering response rates.
Since the adjusted satisfaction survey appears after streamers finish their livestreams, they may be relatively tired this time. Therefore, a 5-level response format can reduce their burden and encourage more genuine feedback.
Wireflow